Introduction
Use of goal package and more specificaly the ‘osm’ group
of functions for the analysis of OpenStreetMap POIs (Points of
Interest) and road network. The following two links, can help on
identifying OSM entities (Municipalities, cities, …)
POIs analysis
Aim: Analyse the location of Amenities and Shops in this
municipality. First install goal library
library(devtools)
#devtools::install_github("dimitrisk/goal", quiet=T)
library(goal)
#library(osmdata)
library(raster)
Amenities
Download all amenities in this municipality (Points or Polygons or Multipolygons)
am = osm.getPOI(inPerioxi = "Mytilene Municipal Unit", inkey = "amenity")
am
Alternatively, we can use a bounding box of an area instead of the name of a municipality.
myt = osm.getPOI_usingbb( c(26.547303,39.101658,26.564641,39.113247), inkey ="amenity" )
myt
After downloading the POIs (am), we merge all POIs
together (Points, Polygons, Multipolygons), and convert them all to
points.
amenities = osm.combineAmenities(am)
amenities
## Simple feature collection with 4847 features and 4 fields
## Geometry type: POINT
## Dimension: XY
## Bounding box: xmin: 26.45563 ymin: 39.00851 xmax: 26.61256 ymax: 39.17293
## Geodetic CRS: WGS 84
## First 10 features:
## osm_id name amenity
## 228266105 228266105 Myitlini Airport (Old) Fire Station fire_station
## 232407341 232407341 <NA> cafe
## 232598112 232598112 ERA Aegean studio
## 232598293 232598293 Πανεπιστήμιο Αιγαίου university
## 247897826 247897826 ΝΕΚΡΟΤΑΦΕΙΟ ΧΡΥΣΟΜΑΛΛΟΥΣΑΣ grave_yard
## 251858327 251858327 Ο.Α.Ε.Δ. school
## 251858392 251858392 Κάδοι απορριμάτων recycling
## 251867613 251867613 <NA> parking
## 251869171 251869171 <NA> parking
## 251869815 251869815 ΣΧΟΛΙΚΟ ΣΥΓΚΡΟΤΗΜΑ school
## geotype geometry
## 228266105 frompolygon POINT (26.60452 39.05245)
## 232407341 frompolygon POINT (26.54987 39.09576)
## 232598112 frompolygon POINT (26.54933 39.09052)
## 232598293 frompolygon POINT (26.5687 39.08468)
## 247897826 frompolygon POINT (26.55574 39.08868)
## 251858327 frompolygon POINT (26.5263 39.14867)
## 251858392 frompolygon POINT (26.52373 39.15504)
## 251867613 frompolygon POINT (26.54363 39.13031)
## 251869171 frompolygon POINT (26.52924 39.14336)
## 251869815 frompolygon POINT (26.52162 39.15466)Frequency table of amenities types in this municipality
freq1 = osm.getFrequency(amenities, inword = "amenity", removeNA = F)
freq1
## # A tibble: 79 × 3
## amenity n freq
## * <chr> <int> <dbl>
## 1 NA 3053 63.0
## 2 bench 556 11.5
## 3 shelter 166 3.42
## 4 place_of_worship 131 2.70
## 5 waste_basket 106 2.19
## 6 cafe 99 2.04
## 7 parking 82 1.69
## 8 toilets 77 1.59
## 9 restaurant 68 1.40
## 10 recycling 48 0.990
## # ℹ 69 more rowsShops
Get all shops in this municipality (Points, Polygons, Multipolygons)
sh = osm.getPOI(inPerioxi = "Mytilene Municipal Unit", inkey = "shop")
sh

#' Merge all shops (Points, Polygons, Multipolygons), and convert them to points.
shops = osm.combineShops(sh)
shops
## Simple feature collection with 1155 features and 4 fields
## Geometry type: POINT
## Dimension: XY
## Bounding box: xmin: 26.4562 ymin: 39.03606 xmax: 26.61245 ymax: 39.1719
## Geodetic CRS: WGS 84
## First 10 features:
## osm_id name shop geotype
## 232597560 232597560 Κωτσόβολος electronics frompolygon
## 251867612 251867612 Lidl supermarket frompolygon
## 251868137 251868137 Chinese Store clothes frompolygon
## 251991641 251991641 ΑΒ Βασιλόπουλος supermarket frompolygon
## 252369882 252369882 Μy Market supermarket frompolygon
## 255945997 255945997 Κοινωνικό παντοπωλείο supermarket frompolygon
## 256627981 256627981 Ανεμώνη confectionery frompolygon
## 257685220 257685220 Φράγκος furniture frompolygon
## 258057913 258057913 Μολυβιάτης toys frompolygon
## 258057914 258057914 Μολυβιάτης toys frompolygon
## geometry
## 232597560 POINT (26.55529 39.10176)
## 251867612 POINT (26.54371 39.13064)
## 251868137 POINT (26.54284 39.12877)
## 251991641 POINT (26.54546 39.12553)
## 252369882 POINT (26.55517 39.1003)
## 255945997 POINT (26.55562 39.1069)
## 256627981 POINT (26.45648 39.03617)
## 257685220 POINT (26.46862 39.12083)
## 258057913 POINT (26.55741 39.10794)
## 258057914 POINT (26.55747 39.10811)Frequency table of shop types in this municipality
freq2 = osm.getFrequency(shops, inword = "shop", removeNA = F)
freq2
## # A tibble: 93 × 3
## shop n freq
## * <chr> <int> <dbl>
## 1 NA 463 40.1
## 2 clothes 91 7.88
## 3 convenience 62 5.37
## 4 hairdresser 40 3.46
## 5 jewelry 27 2.34
## 6 bakery 25 2.16
## 7 supermarket 25 2.16
## 8 kiosk 24 2.08
## 9 shoes 22 1.90
## 10 butcher 20 1.73
## # ℹ 83 more rowsDensity
Create empty raster of this area and get the polygon of this area.
r = osm.CreateEmptyRaster(inPerioxi = "Mytilene Municipal Unit")
#' Get polygon of the area
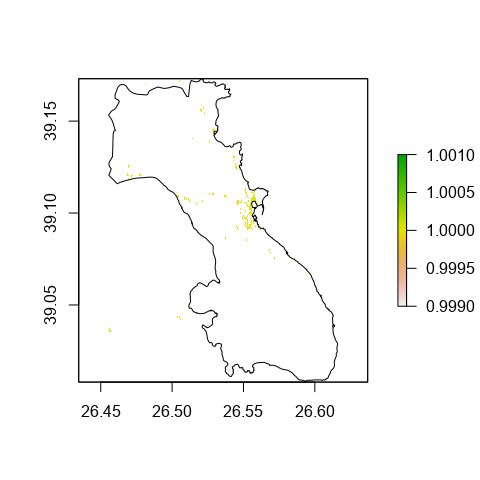
mypol = osmdata::getbb("Mytilene Municipal Unit", format_out = "sf_polygon")$multipolygonSum of shops per cell
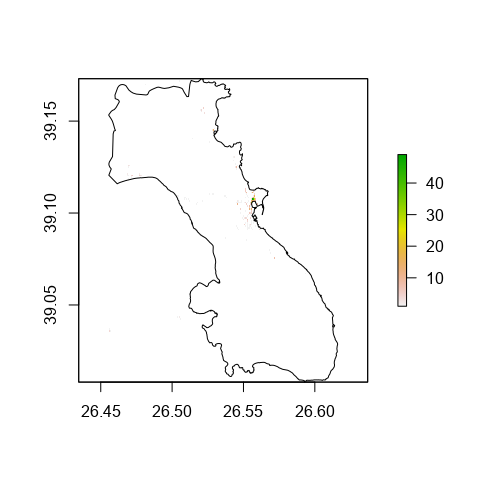
Sum of amenities per cell
density2 = raster::rasterize(amenities, r, field=1, fun=sum) # sum
plot(density2)
plot(mypol, add=T)

Web Map
#' web map1
library(leaflet)
leaflet(amenities) %>% addTiles() %>%  leaflet::addMarkers(popup = ~as.character(amenity), label = ~as.character(amenity))
#' web map2
library(simplevis)
library(dplyr)
library(palmerpenguins)
library(stars)
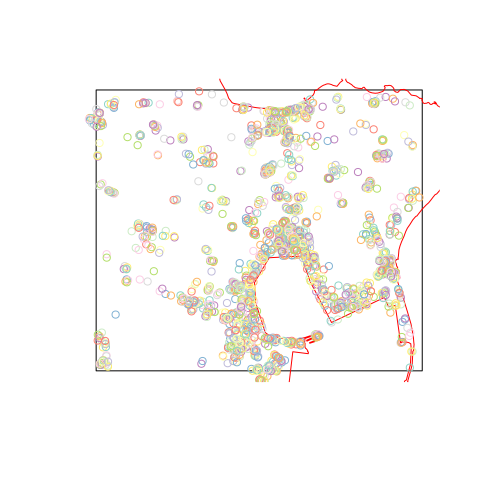
simplevis::leaf_sf_col(amenities, col_var = amenity)Custom bounding box
We now use a custom bounding box and then download data only for this area.
am = osm.getPOI_usingbb( c(26.547303,39.101658,26.564641,39.113247), inkey ="amenity" ) # Download
mypol_bb = osm.osmdata_result_2_bbox_pol(am) # get polygon of this bounding box.
amenities = osm.combineAmenities(am) # combine all amenities into points.
Now get the general polygon of this municipality (coastline)
mypol2 = osmdata::getbb("Mytilene Municipal Unit", format_out = "sf_polygon")$multipolygon
q=c(26.545029,39.088569,26.570177,39.116810)
poly = goal::osm.bb_2_pol(inVec=q, outcrs=2100)
#plot(poly)
What we have so far:

zoomed in:
We need to calculate the intersection between municipality polygon (coastline) and the custom square bounding box we have defined.
clip1 = sf::st_intersection(mypol_bb,mypol2)show the area

Create an empty raster of this intersection:
r = raster(clip1 )Calculate the density of amenities (points) in this clipped area:
density1 = raster::rasterize(amenities, r, field=1, fun=sum) # sum
plot(density1)
plot(clip1, add=T)
plot(as_Spatial(amenities), add=T, cex=0.5)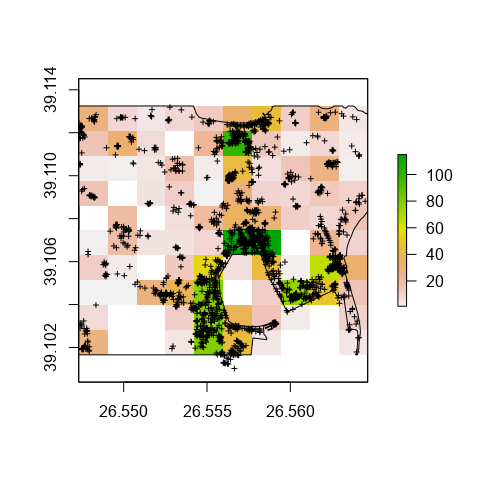
Road network analysis
Get all roads of this municipality by using just the municipality name:
myr1 = osm.getRoads(inPerioxi = "Mytilene Municipal Unit",
                    withBB=FALSE, outcrs = 2100)
##
## Using name of area
myr1## # A sfnetwork with 2536 nodes and 1799 edges
## #
## # CRS: EPSG:2100
## #
## # An undirected multigraph with 775 components with spatially explicit edges
## #
## # A tibble: 2,536 × 1
## geometry
## <POINT [m]>
## 1 (720570.8 4331266)
## 2 (719927.1 4331309)
## 3 (721299.6 4331289)
## 4 (721287.5 4331404)
## 5 (721245.2 4331235)
## 6 (721069.4 4331400)
## # ℹ 2,530 more rows
## #
## # A tibble: 1,799 × 6
## from to osm_id name highway geometry
## <int> <int> <chr> <chr> <chr> <LINESTRING [m]>
## 1 1 2 39428970 Ζωοδόχου Πηγής primary (720570.8 4331266, 720530.6 43312…
## 2 3 4 40847716 8ης Νοεμβρίου primary (721299.6 4331289, 721295.2 43313…
## 3 3 5 40847725 NA primary (721245.2 4331235, 721248.1 43312…
## # ℹ 1,796 more rows
plot(myr1, col="blue", main="sfnetworks Roads (by municipality name)")
Get all roads of this area by using a bounding box:
myr2 = osm.getRoads(incoordinates = c(26.545029,39.088569,26.570177,39.116810),
                    withBB=TRUE, outcrs = 2100 )
##
## Using bbox
myr2## # A sfnetwork with 1011 nodes and 745 edges
## #
## # CRS: EPSG:2100
## #
## # An undirected multigraph with 283 components with spatially explicit edges
## #
## # A tibble: 1,011 × 1
## geometry
## <POINT [m]>
## 1 (720570.8 4331266)
## 2 (719927.1 4331309)
## 3 (721299.6 4331289)
## 4 (721287.5 4331404)
## 5 (721245.2 4331235)
## 6 (721069.4 4331400)
## # ℹ 1,005 more rows
## #
## # A tibble: 745 × 6
## from to osm_id name highway geometry
## <int> <int> <chr> <chr> <chr> <LINESTRING [m]>
## 1 1 2 39428970 Ζωοδόχου Πηγής primary (720570.8 4331266, 720530.6 43312…
## 2 3 4 40847716 8ης Νοεμβρίου primary (721299.6 4331289, 721295.2 43313…
## 3 3 5 40847725 NA primary (721245.2 4331235, 721248.1 43312…
## # ℹ 742 more rows
plot(myr2, col="grey", main="sfnetworks Roads (by bbox)")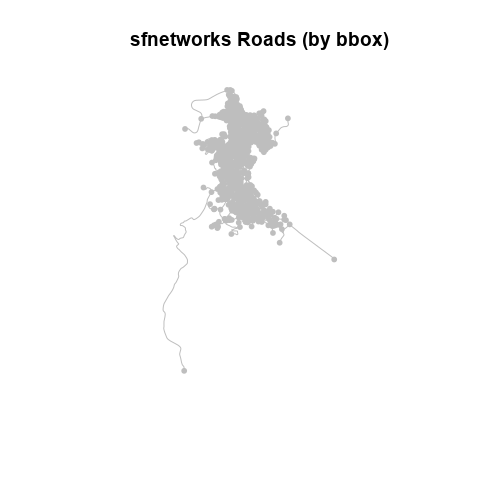
example
q=c(26.545029,39.088569,26.570177,39.116810)
net2 = osm.getRoads(q, withBB=TRUE, outcrs=4326)
##
## Using bbox
poly = osm.bb_2_pol(q, outcrs =  4326)

net3 = osm.ClipSFnetwork_with_poly(net2, poly)

plot(net3,col="grey", main="Clipped sfnetwork")
plot(poly,add=T)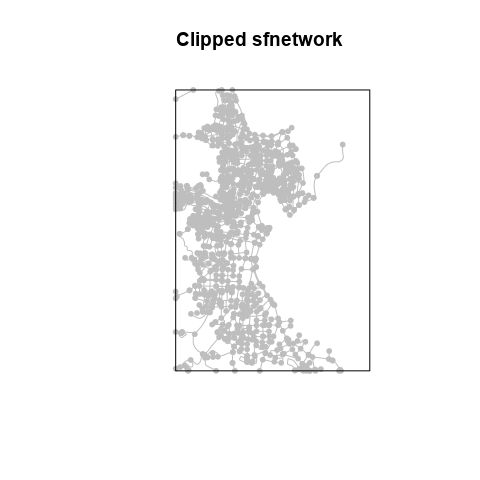
Walkability
Walkability is a measure of accessibility of amenities by foot. A possible proxy way of measuring walkability in a city can be considered the total length of footways of the city. The following function, calculates the total length (and some other statistics) of footways in a city:
library(goal)
mylength = osm.getLength_footway( place="Mytilene Municipal Unit" )
mylength
## $TotalLength
## 44833.45 [m]
##
## $MeanLength
## 97.88964 [m]
##
## $MedianLength
## 27.73577 [m]
##
## $SDLength
## [1] 363.2223
##
## $VarianceLength
## [1] 131930.4
##
## $QuntilesLength
## Units: [m]
## 0% 25% 50% 75% 100%
## 0.6416553 10.7238693 27.7357690 66.1254945 6465.5806419