R/vis.r
vis.BarPlot.Rd
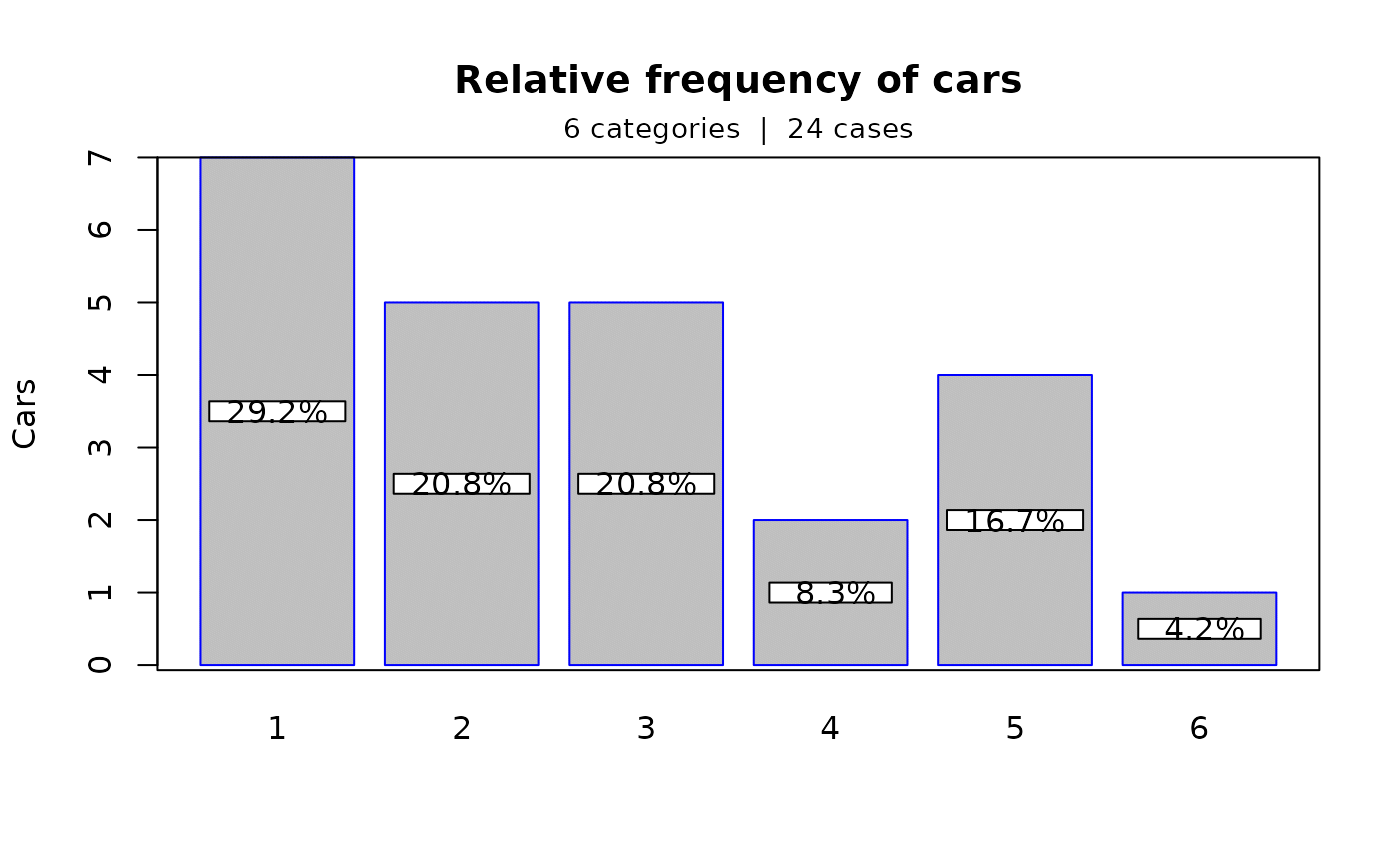
A nice barplot of a table with bar labels and absolute/relative frequencies.
vis.BarPlot(
  inTable,
  percentage = F,
  subtitle = TRUE,
  main = "main",
  ylab = "",
  decimals = 1
)
The table to plot
Whether to use percentages of absolute numbers
Whether to add an informative subtitle in the barplot
The main title of the barplot
The title in the Y axes
Y
Number of decimals to use
A nice barplot of the inTable
inTable
Other vis: vis.Hist()
vis.Hist()
Dimitris Kavroudakis dimitris123@gmail.com
library(goal)
library(plotrix)
cars = table( c(1,1,1,1,3,2,4,3,5,4,6,5,1,5,5,2,2,2,3,3,3,1,1,2) )
vis.BarPlot(inTable = cars, percentage = TRUE,  subtitle = TRUE,
main = "Relative frequency of cars", ylab = "Cars", decimals=1)