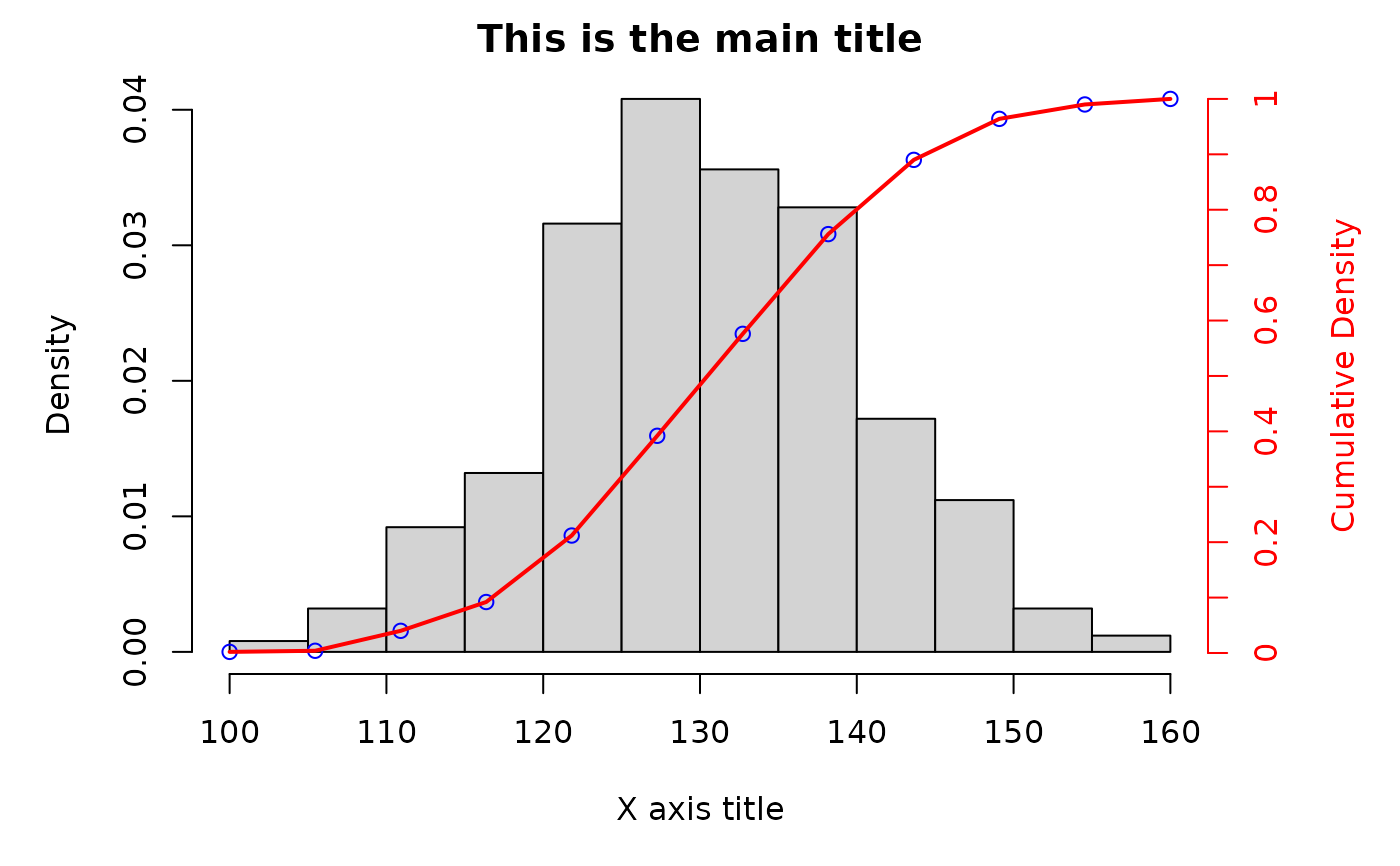
A nice histogram of a single variable with an additional Cumulative Density curve.
vis.Hist(inVector, ecdf = T, ...)
Arguments
- inVector
The vector of numbers to plot
- ecdf
Boolean for the addition of the red line of the Cumulative Density at the right of the histogram plot
- ...
Additional arguments to be passed to the 'hist' command of the base histogram.
Value
A nice histogram of a single variable with an additional Cumulative Density curve.
Examples
library(goal)

set.seed(1821)
myNumbers = rnorm(500, 130, 10)
vis.Hist(myNumbers, freq=FALSE, main="This is the main title", xlab="X axis title")